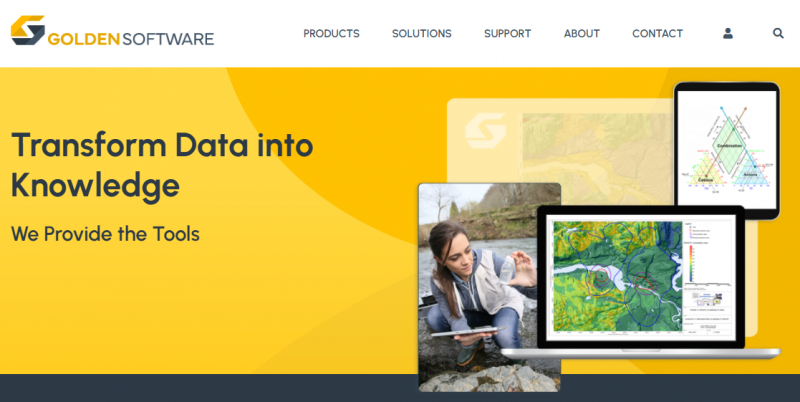
Surfer provides tools for gridding, mapping, and 3D visualization of data. It enables creation of cross sections, profile maps, and 3D views to explore subsurface characteristics, drillhole paths, isosurfaces, and volumes. Users apply mathematical operations on grid files to generate isopach maps, calculate contamination volumes, identify anomalies, model groundwater flow, or compute slope and aspect. It visualizes grids with over 10 map types including contours and surfaces, combined with layers such as aerial photographs, spot locations, drillhole data, and LiDAR point clouds. True 3D interpolation supports point locations, surfaces, drillhole paths, and 3D grids as rendered volumes or isosurfaces. Maps include title blocks, logos, legends, scale bars, and imported imagery. Outputs export to formats like PDF, 3D PDF, TIF, DXF, and KMZ.
Fast and powerful contouring algorithms outperform more expensive packages.
Lightning-fast capabilities transform raw data into maps quickly.
Intuitive interface streamlines efficiency in mapping geological features and visualizing spatial trends.
Requires manual recreation of custom templates without built-in options.
Finding suitable georeferenced imagery sources can be time-consuming.
Rotating 3D models to precise orientations involves tricky mouse adjustments.
14 Days
Yes
Proprietary
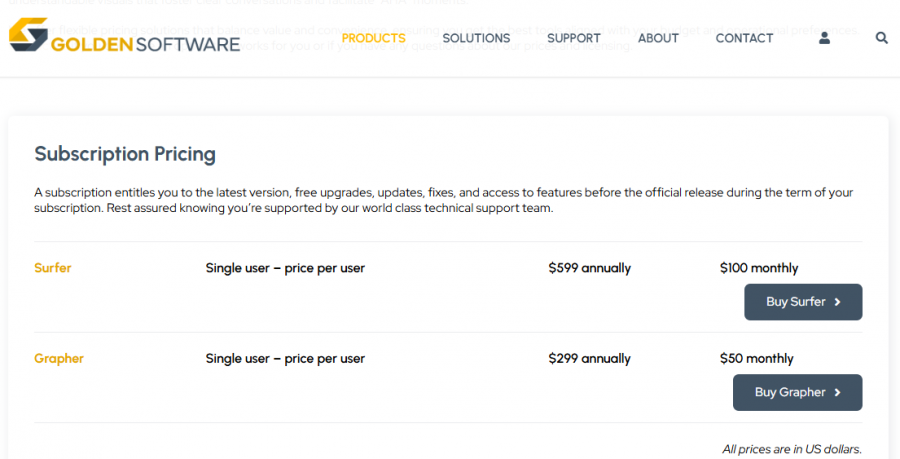
*Check the current pricing on Surfer's website.
Online 3D modeling and slicing Software
The Free and Open Source 3D Creation Software
New Software Testing
Immersive experiences on any device