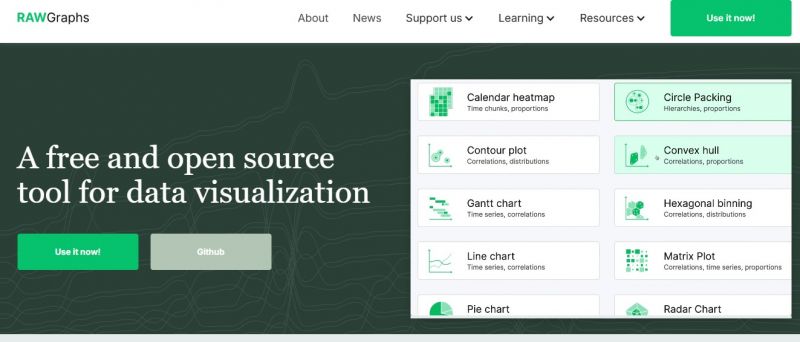
RAWGraphs converts tabular data into vector-based visualizations without coding. It processes data client-side in the browser, handling formats like CSV, TSV, JSON, pasted text, URLs, or SPARQL queries. Users select from nearly 30 chart types, map data fields to visual variables via drag-and-drop, customize appearance, and export as SVG or PNG. Built on D3.js, it bridges spreadsheet applications and vector graphics editors by producing editable SVG outputs. All operations occur locally with no server storage.
Free and open source with no registration required
Processes data only in browser for privacy
Supports wide range of data formats without preprocessing
Produces editable SVG files for further refinement in graphics editors
No installation or coding needed as a web app
Limited to tabular data formats
No support for real-time or streaming data processing
1-7 Days
Yes
Proprietary
Pricing yet to be updated!
All your marketing data. One platform. Instant insights.
Modern BI Dashboard Software
No-Code, Full-Stack Business Intelligence (BI) Software
The Fully Managed Event Streaming Platform
Tableau: Business Intelligence and Analytics Software
Data Analytics Software & AI-Powered BI Platform