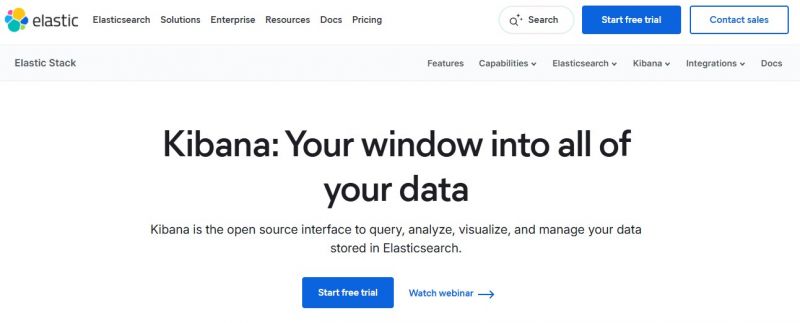
Kibana helps you see and understand your data easily. It works with Elasticsearch to show data in charts, graphs, and dashboards. You can search and explore data in real time. You can also create visual reports to understand patterns and trends. It runs in your browser and is easy to use. It also supports alerts and basic AI features to find problems quickly. Many companies use it to monitor systems and analyze data. Kibana makes complex data simple and clear to understand.
Fast search across large datasets.
Powerful dashboards for real-time analytics.
Custom visualizations for complex data insights.
Scales well with growing data volumes.
Useful for security monitoring and alerts.
Open-source option reduces licensing costs.
Documentation lacks detailed real examples.
1-7 Days
Yes
Proprietary
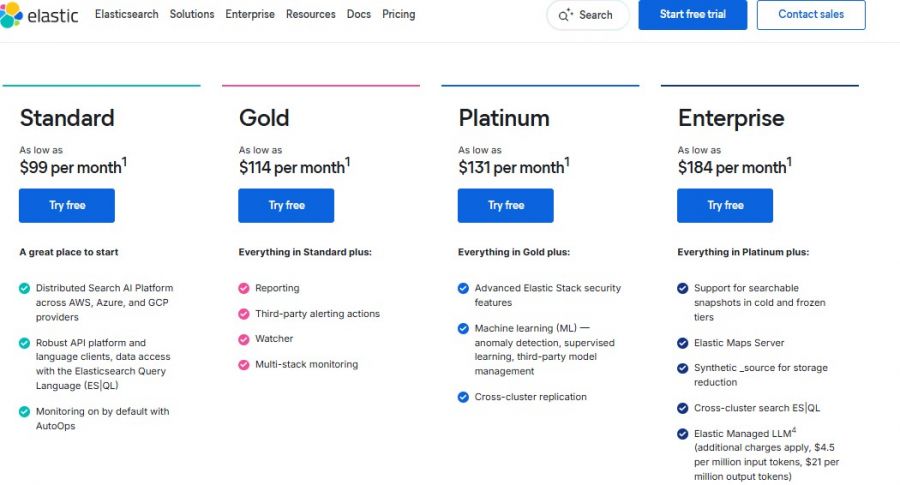
*Check the current pricing on Kibana's website.
All your marketing data. One platform. Instant insights.
Modern BI Dashboard Software
No-Code, Full-Stack Business Intelligence (BI) Software
The Fully Managed Event Streaming Platform
Tableau: Business Intelligence and Analytics Software
Data Analytics Software & AI-Powered BI Platform