On This Page
- Demographic and Market Sizing: Location Shapes Demand
- Pinpointing Patterns with Layered Data Sources
- Real-World Performance: Route Optimization and Logistics
- Environmental Monitoring: From Prevention to Response
- Business Development: Finding What's Next
- Public Health and Emergency Preparedness: Tracking and Reacting
- Social Media Insights: Measuring Engagement and Reach
- New Developments in Mapping Technology
Mapping software has become an essential tool for organizations that depend on spatial analysis. Its use reaches into business strategy, operations, public health, and disaster response. Here is a practical breakdown of the insights available through current mapping platforms, grounded in recent facts, industry studies, and applied examples.
Demographic and Market Sizing: Location Shapes Demand
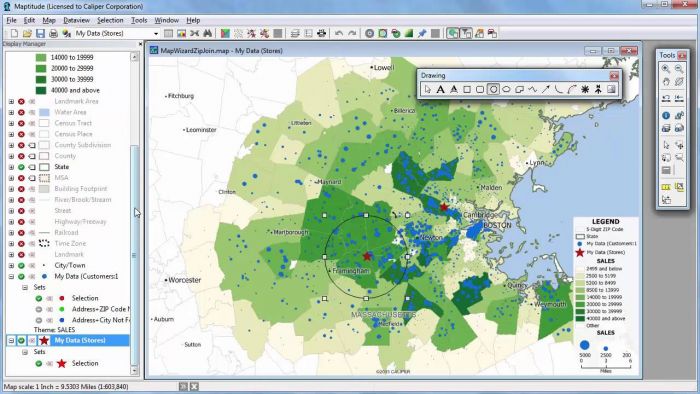
Mapping software connects directly to government datasets, market data, and business records to visualize demographic shifts and population clusters. For example, ArcGIS and Maptitude use United States Census data and localized survey information. These tools let retailers pinpoint neighborhoods with specific purchasing power or age profiles. This enables targeted marketing and store placement, with retail chains noting up to 30 percent lower acquisition costs when identifying high-intent customer zones.
Public agencies use similar tools, overlaying poverty indices with accessibility to services. Municipal planning teams spot trends in both movement and growth, helping prevent resource strain before it occurs. Smappen has been used to display social risk overlays on flood-prone areas, allowing agencies to prioritize response planning where it is needed most.
Pinpointing Patterns with Layered Data Sources
Modern mapping software reveals patterns when you combine sources that might seem unrelated at first. For example, you can examine retail foot traffic alongside local weather records, or overlay consumer spending data with live transit schedules. Using tools like Maptive, these connections result in highly targeted insights, like identifying flood-prone shopping zones or pinpointing neighborhoods with irregular service access.
By cross-referencing health incident reports with population age bands, analysts have identified where emergency services face the most demand spikes. When city planners stack zoning permits on top of census trends, housing density patterns emerge that point out future congestion risks. Each of these results comes from layering data within mapping software and examining where factors overlap.
Real-World Performance: Route Optimization and Logistics
Logistics and supply chain leaders have reported clear utility from mapping features focused on route optimization. Modern mapping tools now include up-to-date traffic, roadwork, and weather data. Using these, teams reduce missed deliveries, shrink fuel consumption by up to 12 to 18 percent, and cut average delivery times by a quarter or more in dense urban settings. An analysis from 2024 found that implementing real-time map updates produced a 40 percent drop in failed deliveries. Tools such as Smappen and ArcGIS have been central to these gains, integrating with shipment trackers and supply databases for rapid intervention at the route planning stage.
Environmental Monitoring: From Prevention to Response
Environmental agencies and non-governmental organizations depend on mapping tools with artificial intelligence capabilities for both monitoring and prediction. In 2025, AI-powered mapping platforms demonstrated 89 percent accuracy at spotting new wildfire risks after ingesting satellite images and climate patterns. City governments use IoT sensors that feed data straight into mapping dashboards, giving real-time warnings when air pollution reaches hazardous levels. Climate research organizations combine mapping software with drone and satellite data to track deforestation and classify land use, providing actionable figures for preservation projects.
Business Development: Finding What's Next
Site planners rely on mapping to assess new business locations effectively. The layering of drive-time rings around potential addresses, as provided in Maptitude, matches customer reach against local competition. Franchises then balance performance data, traffic counts, and zoning laws for granular location selection.
This approach leads to fast, data-backed site approvals. In manufacturing, real-time geospatial mapping is now used by over 68 percent of firms to check live equipment status, with these adoptions leading to 37 percent reductions in production downtime. Predictive analytics extends this capacity, letting companies forecast supply chain disruptions or sales changes based on previous spatial trends.
Public Health and Emergency Preparedness: Tracking and Reacting
Health agencies and emergency managers apply mapping tools during outbreaks or disasters. In 2024, dengue clusters in Asia were mapped, letting teams send resources where case numbers were highest, reducing response times and local mortality. FEMA pre-positioned storm response equipment using models from LightBox, improving supply accuracy before 73 percent of major hurricane landfalls in 2024. Public vaccination drives also benefited; sites chosen based on transport access and demographic overlays achieved a 41 percent improvement in rural immunization rates in India.
Social Media Insights: Measuring Engagement and Reach
Some mapping tools now pull real-time data from social platforms. Journalists can see where public sentiment or events are concentrated by embedding Twitter and Facebook posts on a live map, using apps like Felt and StoryMapJS. Research using Twitter analysis in 2025 showed that urban posts with accurate location tags enjoyed over two times higher engagement than posts from rural users. Businesses apply these features to map out successful campaign regions, measuring performance using plotted social metrics.
For teams looking to translate spatial attention into actions, it becomes important to understand not just where people are, but what they’re intending to do. The art of mapping user intent across stages—from curiosity to conversion—is now crucial, as explored in this guide to user intent mapping. When combined with geospatial data, it turns mapping into a behavioral intelligence platform, not just a visual tool.
New Developments in Mapping Technology
Innovative features in mapping software have surfaced recently. Generative artificial intelligence is now able to build usable maps from plain language queries, saving up to half the usual analyst time. Open data projects, including the Overture Maps Foundation initiative, are distributing accurate building and road data for planning and network expansion. Quantum GIS prototypes now process huge geospatial datasets within seconds, enabling swift simulations for urban planning and environmental impact reports.
Mapping software now produces data with direct impact. It improves operational efficiency, shapes business growth, and builds evidence for planning and risk management. Each insight traced back to its layered, mapped source supports smarter, faster decisions. There is no need to speculate—these patterns are seen on the map, updated daily, ready for action.
Post Comment
Be the first to post comment!