Julius AI can take a dataset, write Python code, generate charts, and explain trends in plain English within minutes. It feels like hiring a data analyst who never sleeps, never complains, and somehow finishes your work before you even open Excel.
Then something odd happens.
The chart looks perfect. The explanation sounds confident. But one column is wrong. One assumption is off. And suddenly the entire insight feels slightly… off.
That is the real story of Julius AI. Not whether it works, but how it works and where it starts to break.
What Julius AI Promises vs What Actually Happens
| Layer | What You Expect | What Actually Happens | Real Gap |
| Input | Upload clean dataset → structured output | Accepts raw data and auto-interprets columns | Hidden assumptions before analysis |
| Analysis | Context-aware insights | Pattern-based statistical inference | No domain understanding |
| Output | Final answer | Draft-level interpretation + charts | Requires validation |
Julius AI rarely gives obviously wrong answers. Instead, it gives convincing answers that are slightly incomplete, which is harder to detect.
Inside the System: What Julius AI Is Actually Doing
| Stage | What Happens | Risk Level |
| Data parsing | Detects column types automatically | Medium |
| Code generation | Writes Python based on prompt | Medium |
| Execution | Runs statistical calculations | Low |
| Interpretation | Converts results into insights | High |
| Output | Visual + text explanation | Very High |
The math layer is reliable.
The explanation layer is where things drift.
Real Testing: What Actually Happened
The login experience was smooth and secure with OTP verification. Immediately after entering, a subscription prompt appeared, which was skipped to access the tool.
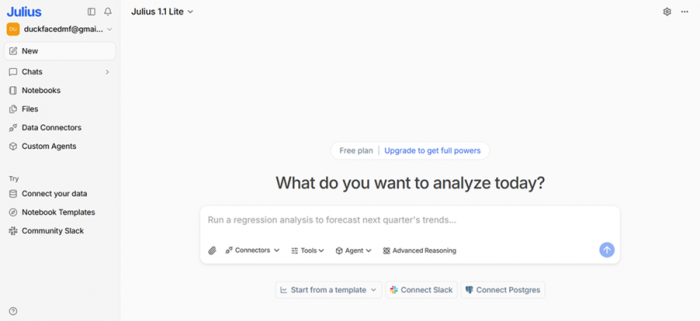
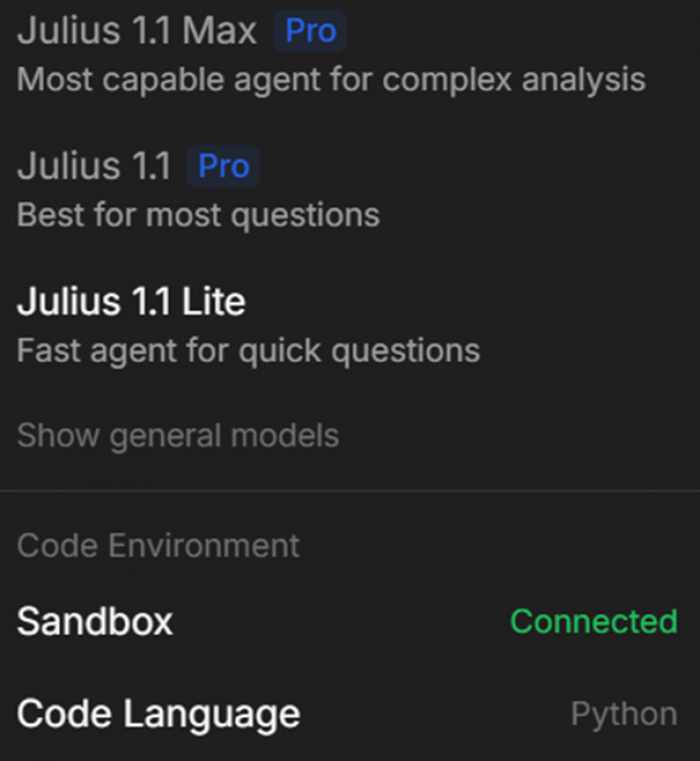
The interface opened into a simple chat environment with three models, with Julius Lite as the default. It also included options like file uploads, connectors, tools, agents, and advanced settings, making it feel more like a data workspace than a chatbot.
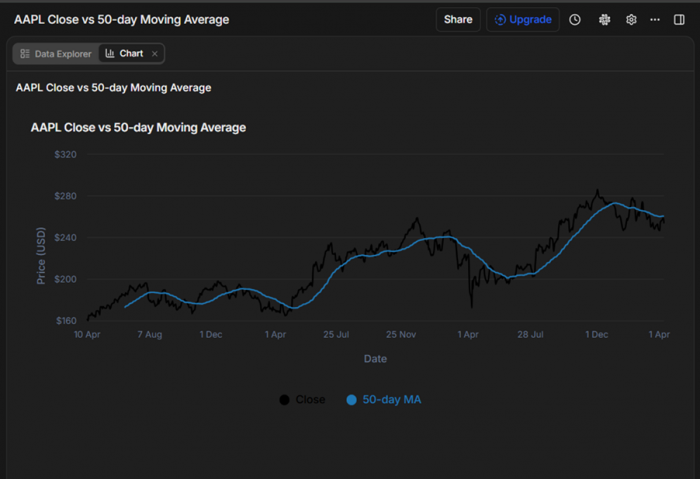
A stock dataset was uploaded and analyzed.
“Stock price trend analysis for Apple Inc”
Julius generated Python code, executed it, and produced a chart. It also surfaced a clear error:
“That error happened because your ma_50 column wasn’t actually numeric (it was effectively all nulls / non-numeric), so the chart config rejected it as a line series.”
This transparency was a strong positive.
But the workflow revealed friction:
- It took ~5 minutes to process a relatively small dataset
- Credits were consumed heavily
- Re-running failed due to credit exhaustion
Testing Breakdown
| Step | What Happened | What Was Right | What Broke |
| Upload | Instant | Smooth UX | No validation checks |
| Code generation | Auto Python output | Transparent logic | Prompt-dependent |
| Chart output | Clean visualization | Structurally accurate | High credit cost |
| Error handling | Explained clearly | Helpful debugging | Still manual fix needed |
| Re-run | Failed | System consistent | Credit limitation |
Pricing Breakdown: What You Actually Pay vs What You Use
Monthly Plans (Detailed)
| Plan | Price | Credits | Compute Power | Data Capability | Real Limitation |
| Plus | $20 | 2,000/month | Basic models | Limited file size | Credits drain quickly during charts |
| Pro | $40 | 4,000/month | Higher compute | DB connectors (Postgres, BigQuery) | Still limited for heavy workflows |
| Max | $200 | 20,000/month | Priority compute | No table limits + agents | Expensive for non-enterprise users |
| Business | $450 | Custom | Dedicated resources | Team dashboards + collaboration | High entry barrier |
Annual Plans
| Plan | Effective Monthly | Credits | Value Insight |
| Plus | $17 | 25,000/year | Best for light experimentation |
| Pro | $33 | 50,000/year | Balanced usage |
| Max | $167 | 250,000/year | High-scale data workflows |
| Business | $375 | Custom | Enterprise-only practicality |
Real Pricing Insight
Credits are consumed not just for interaction, but for:
- Code execution
- Data processing
- Chart rendering
In testing, a single chart consumed more credits than multiple prompts combined.
This means Julius AI is not just a tool you use. It is a system you budget per output.
Speed vs Accuracy Tradeoff
| Factor | Julius AI | Traditional Tools |
| Speed | Extremely high | Low |
| Accuracy | Moderate | High |
| Control | Low | High |
| Transparency | Medium | High |
Julius saves time by skipping steps.
Traditional tools maintain accuracy by forcing control.
Platform Ratings and Review Sentiment
Rating Table
| Platform | Rating | Review Depth | What It Indicates |
| G2 | 4.5 / 5 | Low volume | Early positive adoption |
| Trustpilot | ~3.0 / 5 | Mixed | Reliability concerns |
| Product reviews (aggregated) | ~4.2 / 5 | Moderate | Strong usability, mixed trust |
| Technical forums | Mixed | High credibility | Skepticism for serious use |
What Users Say
- “It’s fast and surprisingly capable, but I still double-check results”
- “Great for quick analysis, not something I’d rely on for final decisions”
- “Feels powerful, but sometimes unclear how it reached conclusions”

The Core Problem
- AI predicts patterns, it does not understand context
- Outputs are generated, not verified
- Errors are subtle, not obvious
- Speed increases trust, even when accuracy drops
Julius AI creates confidence before certainty.
That is the real risk.
Where Julius AI Fits in a Real Workflow
| Stage | Effectiveness | Role |
| Exploration | High | Fast pattern discovery |
| Initial insights | Moderate | Idea generation |
| Decision making | Low | Requires validation |
| Final reporting | Low | Not reliable alone |
Final Positioning
Julius AI is not trying to replace analysts. It is trying to remove the barrier to analysis. And in that, it succeeds.
It makes data approachable. It reduces technical friction. It accelerates early-stage thinking.
But it does not replace judgment.
The tool operates on probability, not intent. It produces outputs that feel complete, even when they are not fully grounded in context. That makes it powerful for exploration and risky for execution.
The smartest way to use Julius AI is not to trust it less, but to place it correctly in the workflow. Use it to discover, not to decide. Use it to explore, not to finalize.
Because the real difference is simple.
Julius AI gives you answers quickly.
But it is still your responsibility to decide if they are right.





David Cooper
Apr 15, 2026As someone interested in creativity and presentation tools, I recently came across [Havi AI presentation maker](https://www.havi.ai), and it looks like a promising platform for creating visualisations and slides quickly using AI. Tools like this are becoming really valuable for turning ideas into clear presentations without spending hours designing. Has anyone here tried using AI tools for building presentations or visual storytelling? I’d be curious to hear how they compare with traditional slide-creation workflows.